
💡 The ingredients movements report is available on the Mini, Business, and Pro plans.
How to open the Ingredients movements report
- Open the Inventory → Ingredients movements tab in the Poster management console.
- Click the Last 7 days button above the table and select the period you want to view product movement for: Today, Yesterday, Last 7 days, Last 30 days, This month, Last month, All time, or Custom period.
- Select a storage location to see product movement and the cost price of inventory at that specific location. There's a search field in the list, and you can select several storage locations at once.
- If your account combines several locations of a chain, select the location you need. The report will show the inventory of products at the storage locations linked to that location.
- Select the inventory type: ingredients, products, product modifiers, manufactured preparations, or manufactured dishes.
- If needed, select a category of ingredients or products and dishes.
- Click + Filter and choose Name to find a specific product by its name.
- In the Columns window, choose the data you want to see in the report: Name, Type, Initial balance, Initial avg. cost,Initial cost, Supplies, Expense, Final balance, Final avg. cost , Tot. cost.
Check the boxes next to the columns you need and click Apply. To change the column order, drag the column names. To change the width, drag the border between columns.
💡 To restore the default set of columns, click Reset to default. - To reset all applied report settings at once, click Reset all in the filter bar.
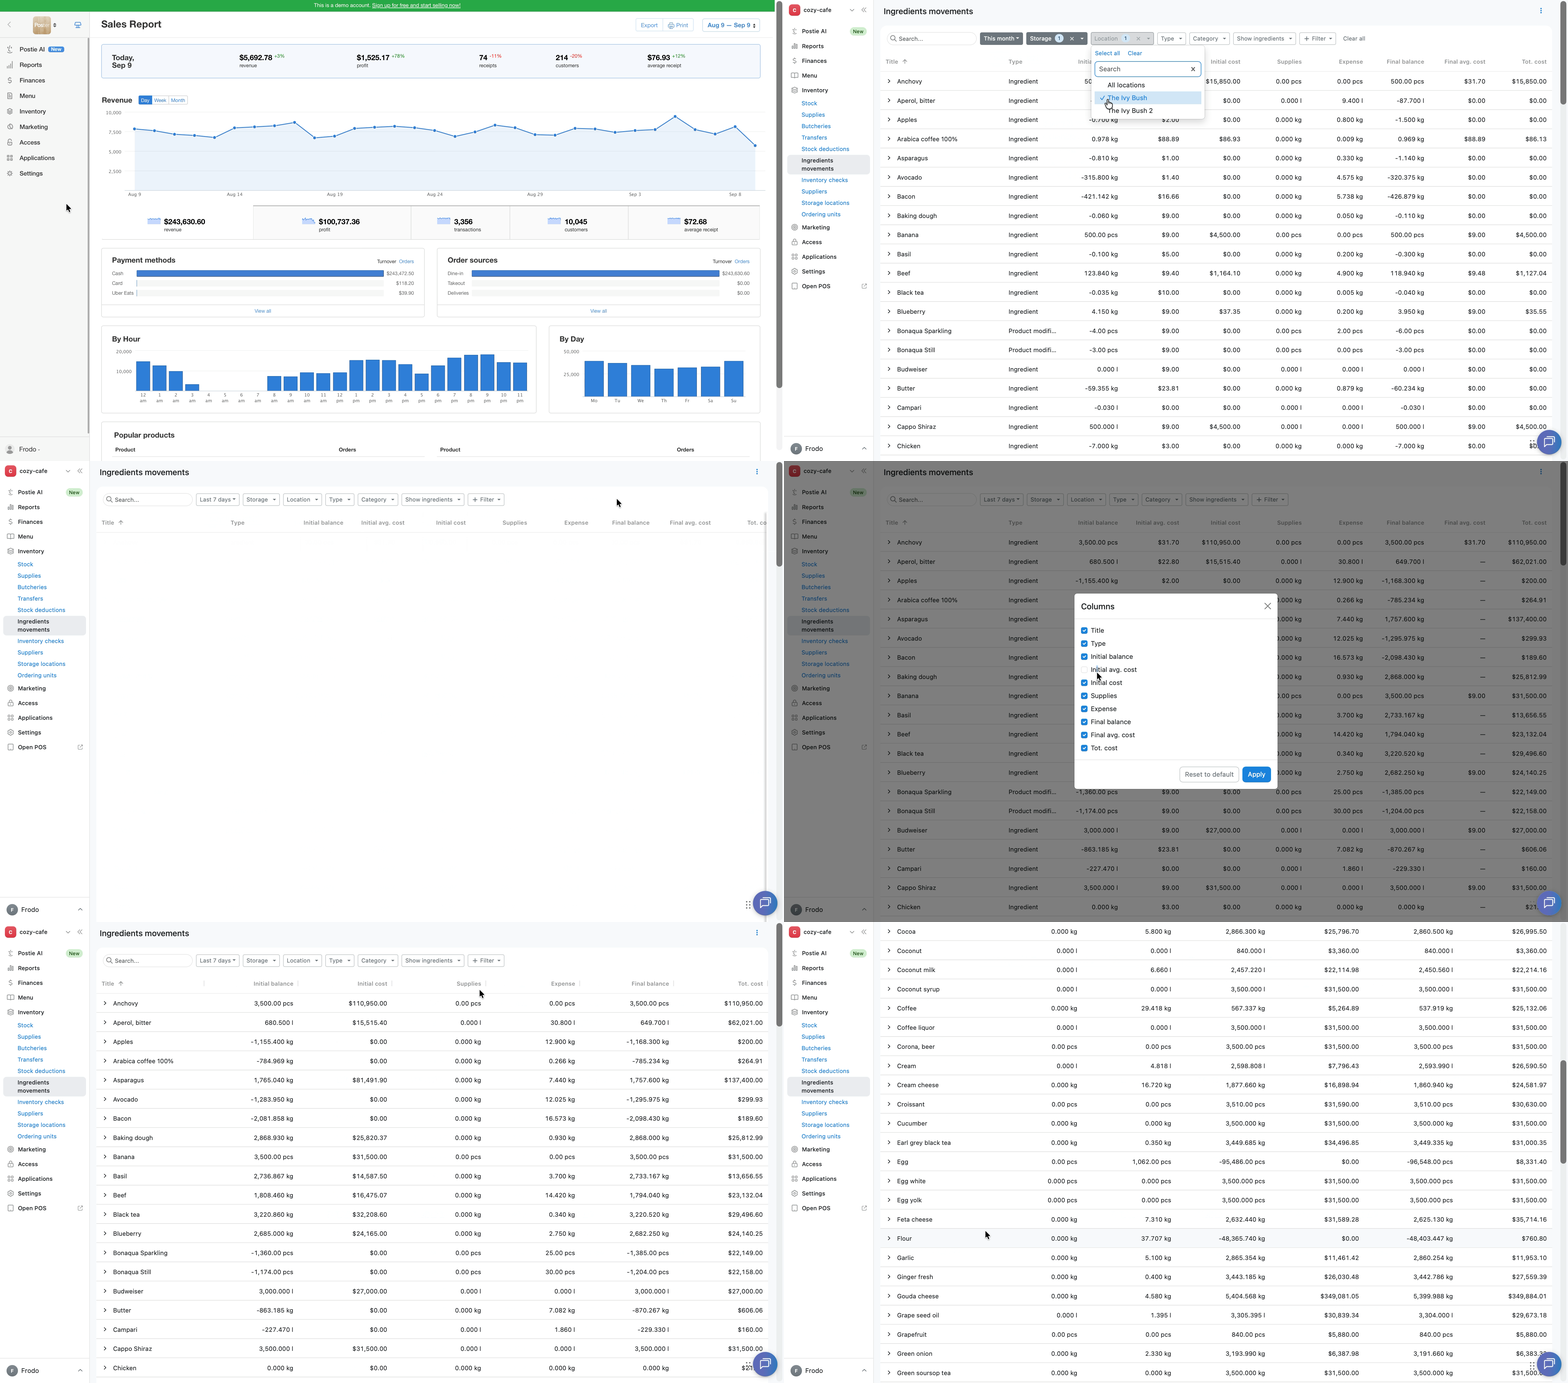
If there are many products, they may not fit on a single page. To find the product you need, scroll to the end of the list and switch pages using the arrows at the bottom of the table.
How to read the Ingredients movements report
The report shows how product inventory changed over the selected period:
- Opening and closing value — the value of inventory at the start and end of the selected period.
- Supplies — the quantity and value of products received at the storage location. Click the > arrow next to a product name to expand the row and see a breakdown of receipts by movement type: Supply, Inventory check, Butchery.
- Expense — the quantity and value of products that were used. Click the > arrow next to a product name to expand the row and see a breakdown of consumption by movement type: Sales, Manual waste Manufacture, Inventory check, Butchery.
- Total — the monetary value of the product's remaining inventory at the end of the selected period, accounting for all product movements during that period.
☝️ To see only products that had receipts or consumption during the selected period, click the Show ingredients filter above the table and select With movement only. To see all products, click the Show ingredients filter and select All, inc. without movement.
To check the balance of each product and its value on a specific date, select the Show ingredients → All, inc. without movement filter and look at the values in the Final balance and Total columns.
How to export the Ingredients movements report
- Open the Inventory → Ingredients movements tab in the Poster management console.
- Select the period you need using the period button above the table.
- Set up the filters and columns you need.
- Click ⋮ in the top-right corner of the screen and select Export. An Excel file with the .xlsx extension will download, containing the data from the columns included in the export.
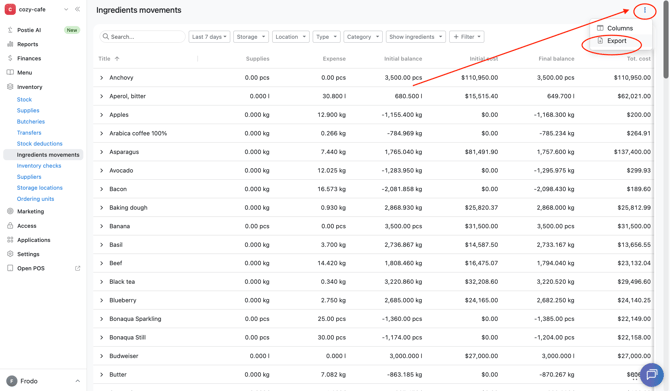
💡 To print the report, open the downloaded Excel file and print it.
Limitations of the
Ingredients movements report
- The ingredients movement report isn't available on all pricing plans — only on Mini, Business, and Pro.
- Dishes and preparations appear in the report as separate line items only after manufacturing. Before that, the report shows the movement of the ingredients that make them up.
- The cost price of products and ingredients in the ingredients movement report is calculated using the weighted average cost method.
- The report shows data by calendar day, not by cash register shifts.
-
The standard ingredients movement report doesn't offer hourly detail. In the Inventory → Ingredients movements report tab, data is displayed by day. If you need more detailed movement analysis, use the free Transfers report app.
Transfers report app
The Transfers report app is designed for hourly analysis of product movement and a more detailed breakdown of write-offs.
The Transfers report helps you:
- View product movement by hour — for example, to determine what time of day the most ingredients are used.
- Understand the reasons behind write-offs — see exactly what caused the movement: sale, dish (recipe), manual write-off, refund, inventory check, etc.
- Quickly find the data you need by ingredient, category, storage location, date, and time.
- Save and use the report in a convenient format — export to Excel, save as PDF, or print.
💡 The app is free. Connect it via the link.
If you have questions about product movement or need help working with the report, message us in chat.